Ready to learn how to create more engaging Instagram Stories based on data?
If you want to increase sales or engagement with your Instagram Stories, analyzing their performance is a must.
If you are using Socialinsider Stories Analytics you will know:
- What type of Stories perform better on Instagram - photos or videos
- Top hashtags used in Stories as text
- How many Stories you should post for better engagement
To help you understand your Instagram Stories, we’ve made a little update, and we divided Stories insights into:
- Stories Overview - here is the list of metrics you’ll see in this section
- Stories Analytics per Day
In this guide, we explain where you can see Stories per Day in the dashboard, and what data you will get.
Stories per Day insights
Choose the profile from the sidebar, select the period you want to analyze your Stories, then click - Stories per Day from the menu.
You can sort them by:
- Date
- Impressions
- Reach
- Replies
- Exits
- Taps forward
- Taps back

Or you can filter them: photos or videos.
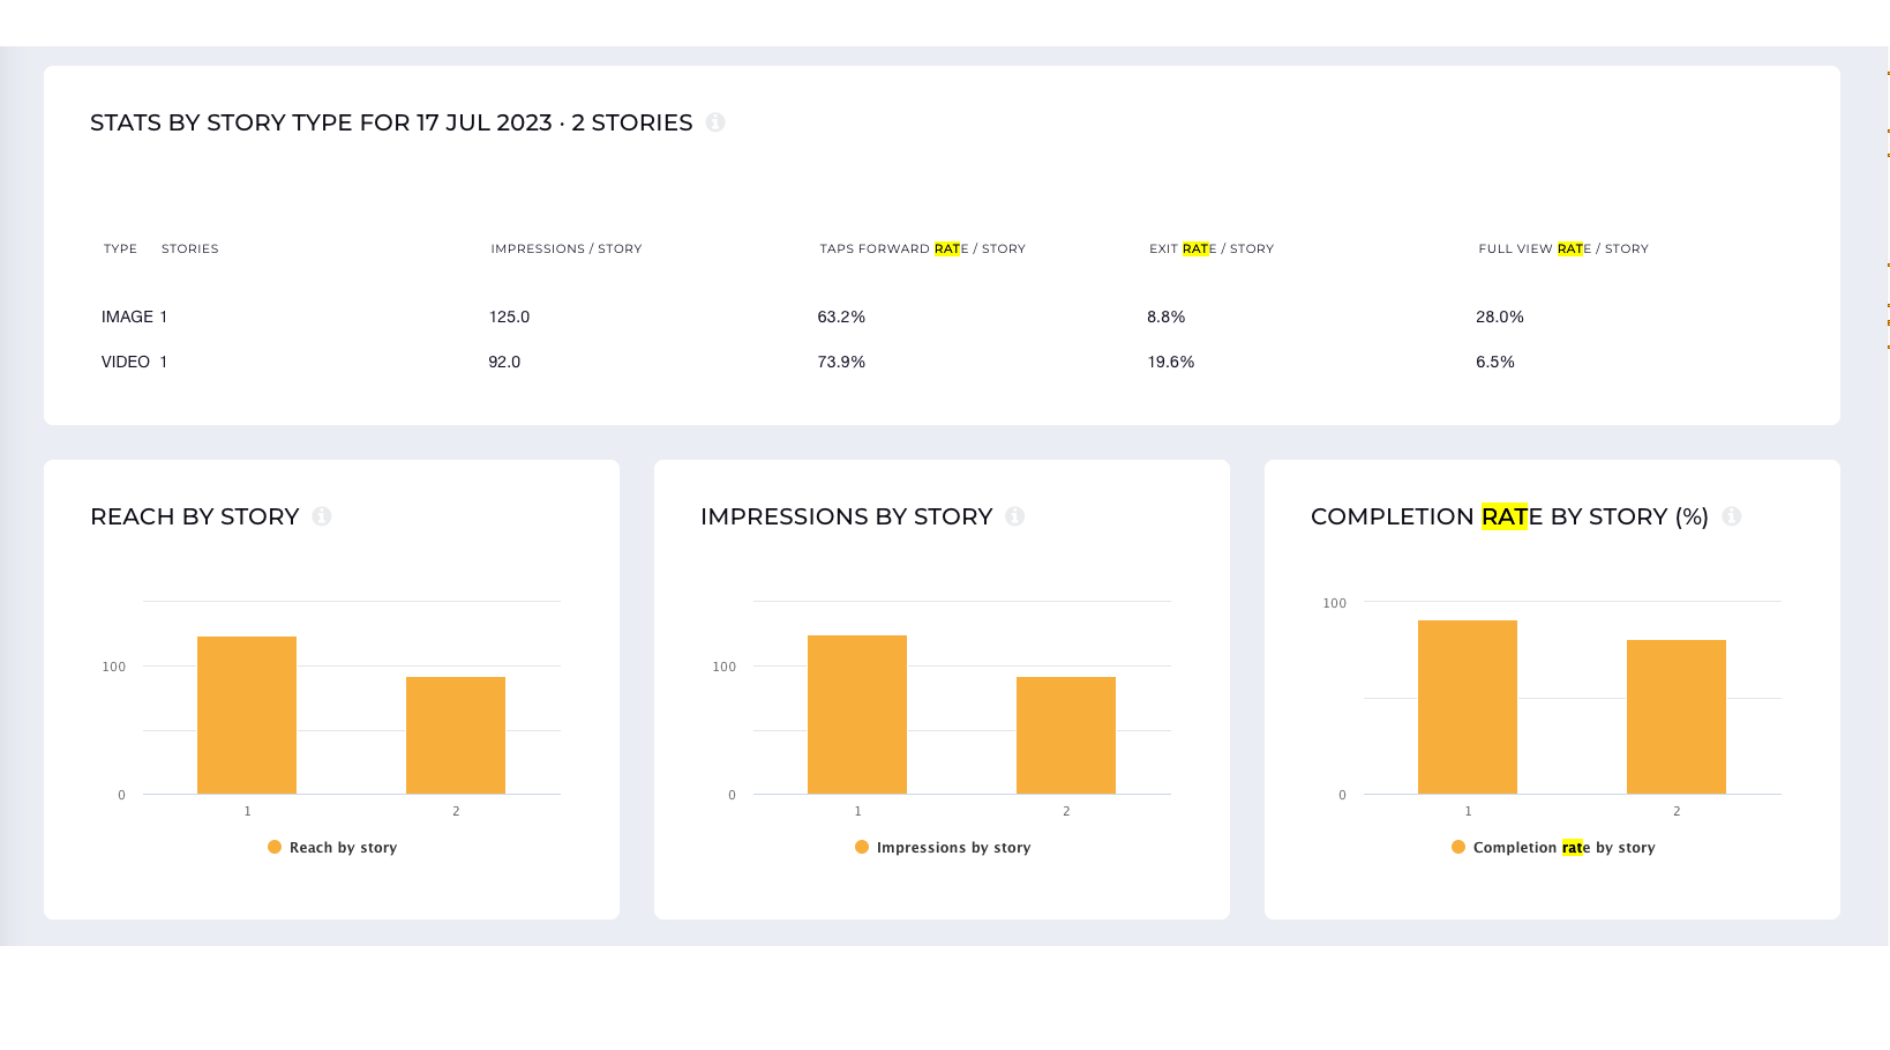
Another important option is that you can select the stories from a specific day, and you’ll see:
Type - the type of story (image/video)
Stories - the total number of stories in that specific day
Impressions/story - how the impressions progressed through the story
Taps forward rate/story - the percentage of your Story impressions that have a tap forward
Exit rate/story - The percentage of your impressions that exit your Stories by swiping right, swiping down, or closing Stories
Full view rate/story - the percentage of impressions without exits nor taps forward, to impressions
Reach by story - how the reach progressed through the story
Impressions by story - how the impressions progressed through the story
Completion rate/Story - the completion rate per story
We hope you like this update.
PS: Wondering how to analyze your competitors' performance on Instagram with Socialinsider? Here's a short guide for you.