Here are the LinkedIn insights that you'll see once you start analyzing a LinkedIn business page with Socialinsider.
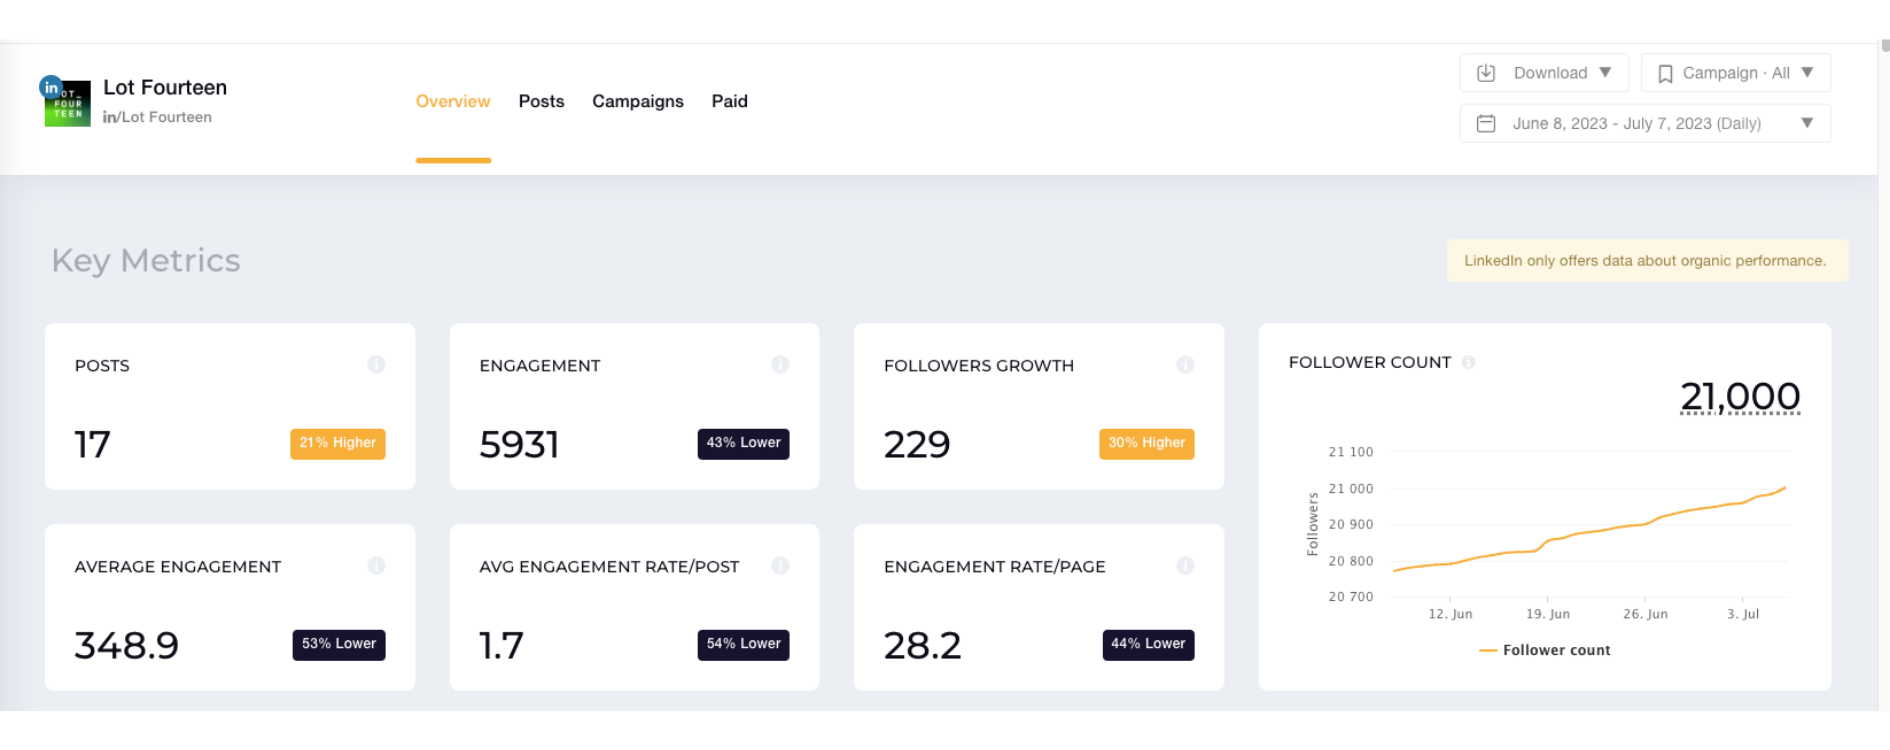
Key metrics:
- Posts - The number of posts published in the selected time period.
- Engagement - The sum of likes, comments, clicks, and shares received for the posts published in the selected time period. Content performance is organic only.
- Followers growth - The difference in follower count between the end date and the start date of the selected time period. We only have the follower count from the day someone first adds the page in Socialinsider.
- Average engagement - The engagement of the posts (likes, comments, clicks, and shares) divided by the number of posts published in the selected time period.
- Average engagement rate/ post - The average engagement of the posts divided by the number of followers the page has all multiplied by 100.
- Engagement rate/ page - Percentage of the follower base of the page that engaged with the posts in the selected time period.
Posts insights:
- Posts evolution - The day-to-day variation of the number of posts published in the selected time period.
- Average posts/ day- The average number of posts published each day during the selected time period. This is calculated as the total number of posts divided by the number of days in the selected time period.
- Top 3 posts - The top 3 posts published in the selected time period.
- Posts by type - What type of content did the page publish? This shows the number of articles, images, videos, documents, and references published in the selected time period.
- Total Reach - The number of people who have seen any post published in the selected time period.
- Posts Reach - The day-to-day evolution of the number of people who have seen any post published in the selected time period.
- Total Impressions - The total number of impressions received for the posts published in the selected time period. The impressions of a post represent the number of times that specific post was seen.
- Impressions Evolution - The day-to-day evolution of the number of impressions received for the posts published in the selected time period.
- Impressions by Post Types - Distribution of impressions by the type of post published in the selected time period.
Followers insights:
- Gained followers - The day-to-day variation of the organic and paid followers gained in the selected time period.
- Followers growth percent - The increase in the follower count between the end date and the start date of the selected time period. This is shown as a percentage.
Engagement insights:
- Engagement evolution - The day-to-day evolution of the engagement which is calculated as the sum of likes, comments, and shares received on the posts in the selected time period.
- Average engagement/ day - This is the average engagement received in one day. This is calculated as the average engagement of all posts published in the selected time period divided by the number of days in that interval.
- Likes evolution - The day-by-day distribution of the number of likes received for the posts published in the selected time period. It includes all reactions (like, celebrate, support, love, insightful, curious).
- Likes - The number of likes received for the posts published in the selected time period.
- Comments evolution - The day-by-day distribution of the number of comments received for the posts published in the selected time period.
- Comments - The number of comments received for the posts published in the selected time period.
- Clicks - The number of clicks for each post published in the selected time period.
Video insights:
- Video views evolution - The day-to-day variation of the number of times your videos were played. This is for the videos published in the selected time period.
- Total video views - The number of times your videos were played. This is for the videos published in the selected time period.
- Average views per video - The average number of views per video. This is calculated as the total video views divided by the number of videos published in the selected time period.
- Video watch time evolution - This chart shows the day-to-day variation of the number of minutes spent watching the videos published in the selected time period.
- Total video views - The number of minutes spent watching the videos published in the selected time period.
- Average watch time per video - The average number of minutes spent watching per video. This is calculated as the total number of minutes watched divided by the number of videos published in the selected time period.
Demographics:
- Geographical Distribution of Followers - The global distribution of the page’s followers (world map).
- Follower Seniority - Followers' seniority within their company.
- Follower Function - Folowers' role within their company.
- Follower Industry - The industry in which the followers work.
- Follower Company Size - The size of the companies in which the followers work.
Note! Keep in mind that LinkedIn only offers data about organic performance.
Remember that you can also download all these insights as a report in a PDF, PPT, or XLS format. You can do that from the top right side of the page.
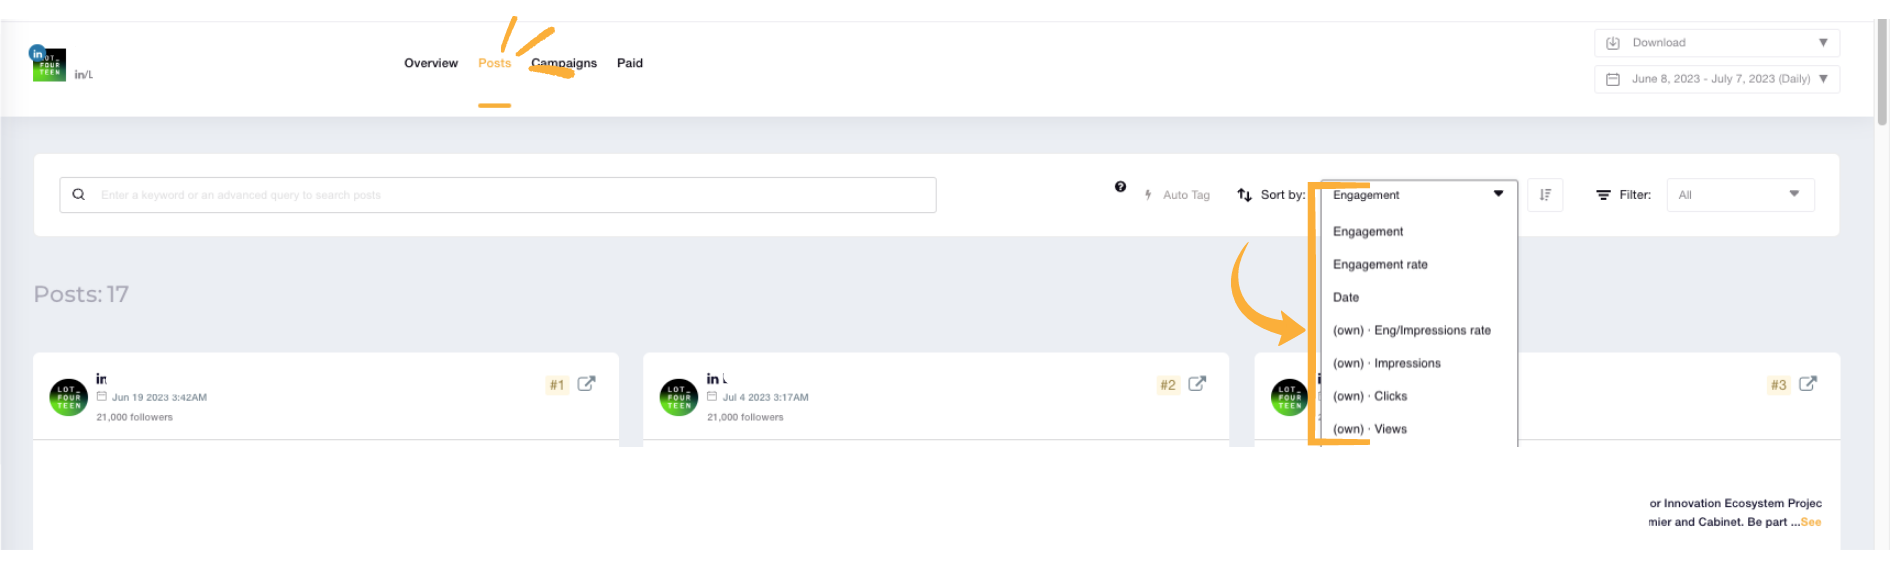
-> NEW: Only for connected LinkedIn accounts you can now sort the posts by video views and clicks.
Reports:
You can now download XLS + CSV reports from the LinkedIn Benchmarks section.
In the XLS report you can also check the number of saves for each post :)